Raw sugar vs white sugar: two distinct traded products
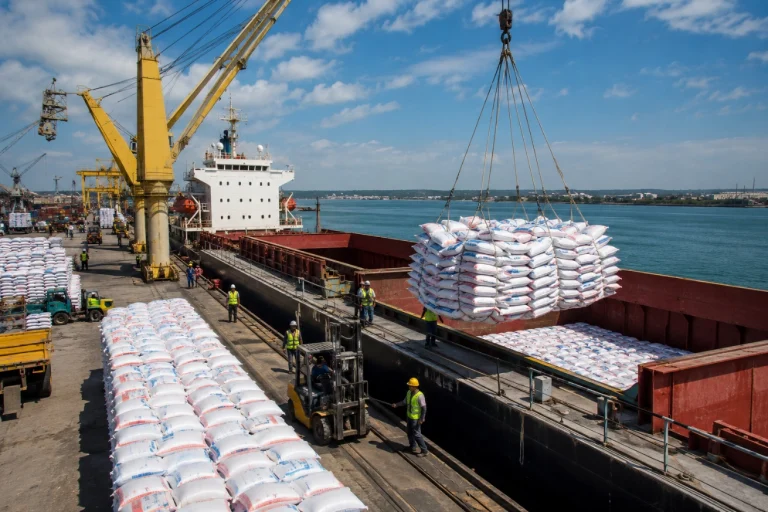
Sugar trades in two primary forms that serve different buyers, move through different supply chains, and are priced against different benchmark contracts. Understanding the distinction is essential for procurement teams, whether they are sourcing for industrial food manufacturing or for refining operations.
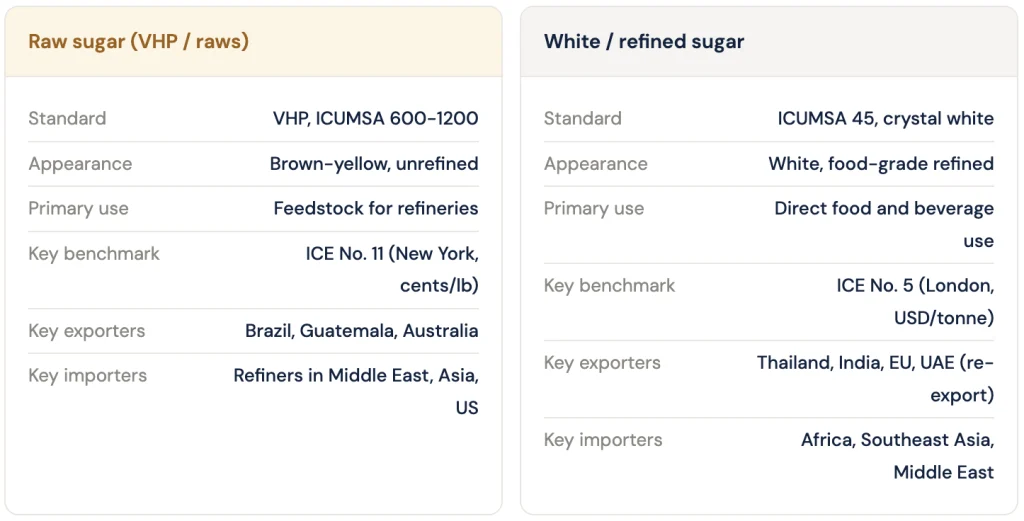
The spread between No. 11 and No. 5 contracts, known as the white premium, reflects the cost and margin of refining and is closely monitored by buyers who can choose between raw and refined origins. When the white premium widens, it becomes more profitable to import raws and refine domestically; when it narrows, importing ready-to-use white sugar is more economical.

Key producing and exporting countries
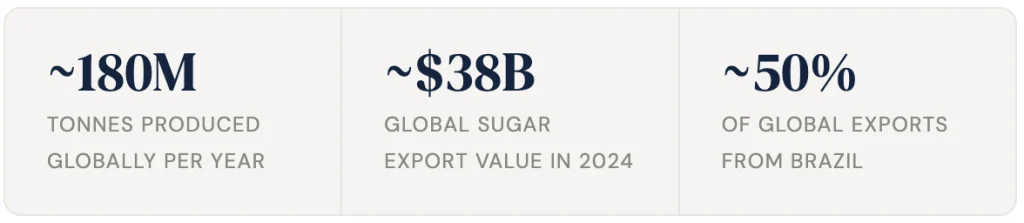
Global sugar exports are more concentrated in a single origin than almost any other bulk agricultural commodity. Brazil accounts for roughly half of all globally traded sugar by volume, and its cane crush output, ethanol allocation decisions, and the BRL-USD exchange rate together define the floor price for world sugar in most seasons.
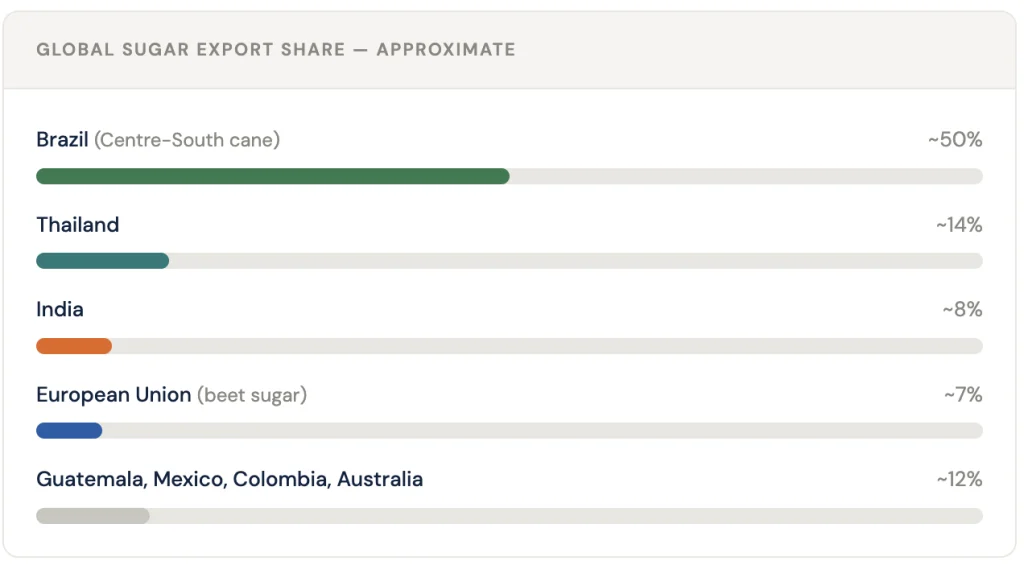
Brazil’s Centre-South region, centred on Sao Paulo state, is the world’s most productive sugarcane area. It crushes around 600-620 million tonnes of cane per season, converting roughly 51% into sugar and 49% into ethanol. The flexibility of this allocation is the market’s most important structural feature. Brazilian mills can shift the mix seasonally, making Brazilian export volumes highly responsive to the relative profitability of sugar versus ethanol at any given time.
The sugar-ethanol parity switch
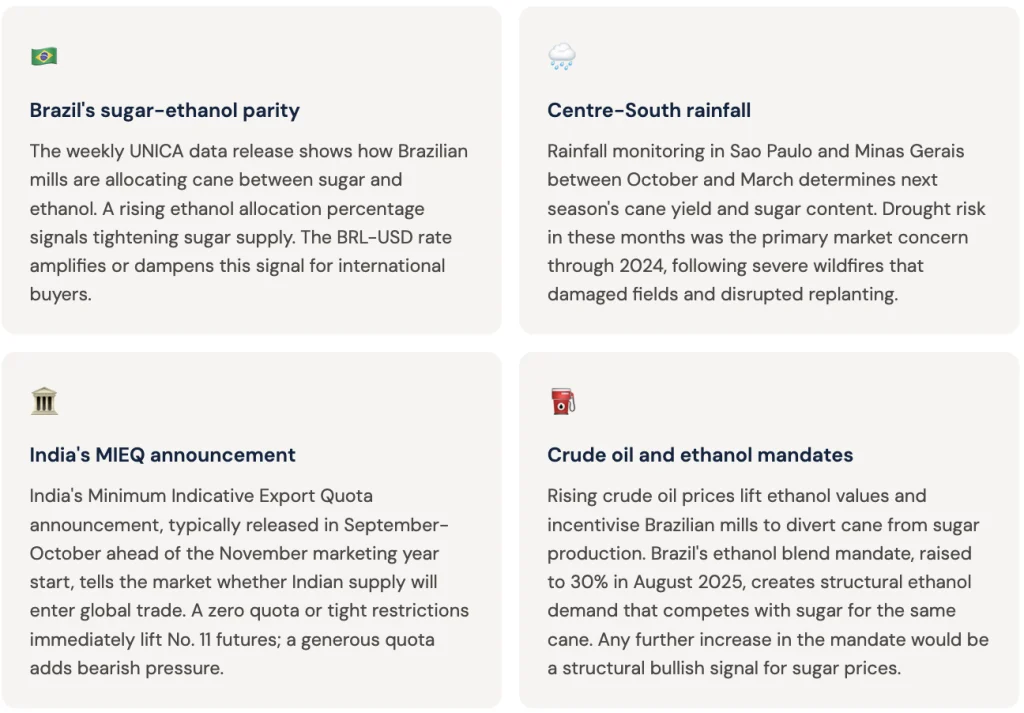
Brazilian mills monitor the price of ICE No. 11 sugar futures against the domestic ethanol price converted into a sugar equivalent. When sugar prices are higher in real terms, mills crush more cane for sugar, increasing global export availability and capping prices. When ethanol becomes more profitable, sugar output falls and global prices rise. This parity calculation is the most watched real-time indicator in the global sugar market, updated weekly by UNICA and CONSECANA.
 BusinessIndian Sugar Industry Navigates a Tight Squeeze Amid Surplus and Cost Pressures
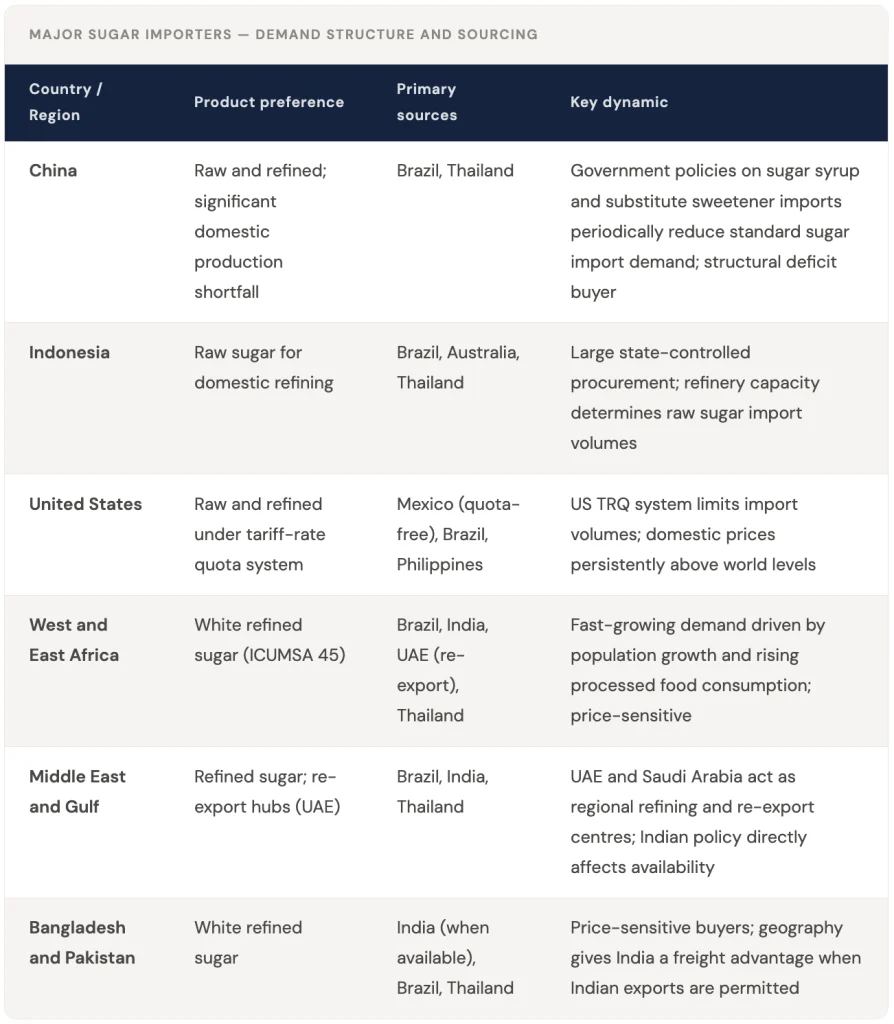
Key importing countries and global sugar import patterns
India’s sugar export policy: the market’s second-order variable
India is the world’s second-largest sugar producer, with annual output of 25-35 million tonnes depending on monsoon performance. Most of this is consumed domestically — India is also the world’s largest consumer — but in surplus years, India’s export volumes can be material enough to move the global No. 11 price.
The Indian government controls sugar exports through a quota system. When domestic stocks are comfortable and cane farmers require income support, India releases export quotas. When domestic prices rise above politically acceptable levels, it restricts exports. Exporters and buyers track the government’s Minimum Indicative Export Quota (MIEQ) announcements closely because they are the primary signal of when Indian supply will enter global trade.
India’s 2023-2024 export restrictions
India banned sugar exports in 2023 and maintained restrictions through 2024 following an El Nino-related drought that reduced cane output. The ban removed an estimated 5-6 million tonnes of potential export supply from world markets. India’s production recovered strongly to an estimated 35 million tonnes in 2025/26, prompting the government to permit limited exports again and contributing to the global price softness that followed.
What drives sugar prices
- Brazil’s Centre-South crush and sugar-ethanol mix
The most important live variable in global sugar pricing. When Brazilian mills allocate more cane toward sugar, global export volumes rise and prices soften. When ethanol becomes more profitable — typically when crude oil prices are high and Brazil’s domestic fuel blend mandates tighten — sugar output falls and prices rise. The weekly UNICA crush data release is the most market-moving scheduled data point in the sugar calendar. - Brazil’s weather and cane crop quality
The Centre-South harvest runs April-December. Drought during the vegetative phase (October-March) reduces cane yield and sugar content. The severe drought and wildfires of 2024 damaged cane fields in Sao Paulo and Minas Gerais, reducing both current-season output and the next season’s ratoon crop quality. Brazilian weather is the single most watched supply-side risk factor outside of the ethanol parity calculation. - India’s domestic crop and export quota decisions
India’s kharif sugarcane harvest, completed November-April, determines domestic stock levels and the government’s export quota decision. A weak Indian monsoon typically reduces cane yield and tightens both domestic supply and export availability. The government’s MIEQ announcement, usually made in September-October, tells the market how much Indian supply will enter the coming season’s trade. - The BRL-USD exchange rate
Brazil prices its sugar in US dollars but its costs are in Brazilian reals. When the BRL weakens against the dollar, Brazilian sugar becomes cheaper in dollar terms, lifting export competitiveness and increasing pressure on global prices. The BRL-USD rate is a live input in every Brazilian mill’s decision on whether to sell sugar forward or hold inventory. - Crude oil prices and ethanol demand
Through the parity mechanism, crude oil prices affect sugar output. When crude rises, ethanol becomes more valuable, incentivising mills to divert cane toward ethanol production. This reduces sugar output and export availability. Brazil’s mandatory ethanol blending ratio — raised from 27% to 30% in August 2025 — increases structural domestic ethanol demand and may persistently reduce the share of cane allocated to sugar. - Thailand’s recovery and Asian supply
Thailand is the third-largest sugar exporter globally, supplying Asian markets — particularly Indonesia, Malaysia, South Korea, and increasingly China. After two consecutive drought-affected seasons in 2022 and 2023, Thailand’s cane sector recovered strongly in 2024-25, adding to global supply and contributing to the price weakness seen through much of 2025. Thai harvest conditions are the most significant supply variable for Asian buyers after Brazil.
Seasonal patterns
The global sugar calendar has two major supply pulses driven by Brazil’s Centre-South harvest and Thailand’s harvest, which are partially counter-seasonal. India’s harvest falls in the northern hemisphere winter, providing a third supply window that activates only when Indian domestic stocks are sufficient to permit exports.
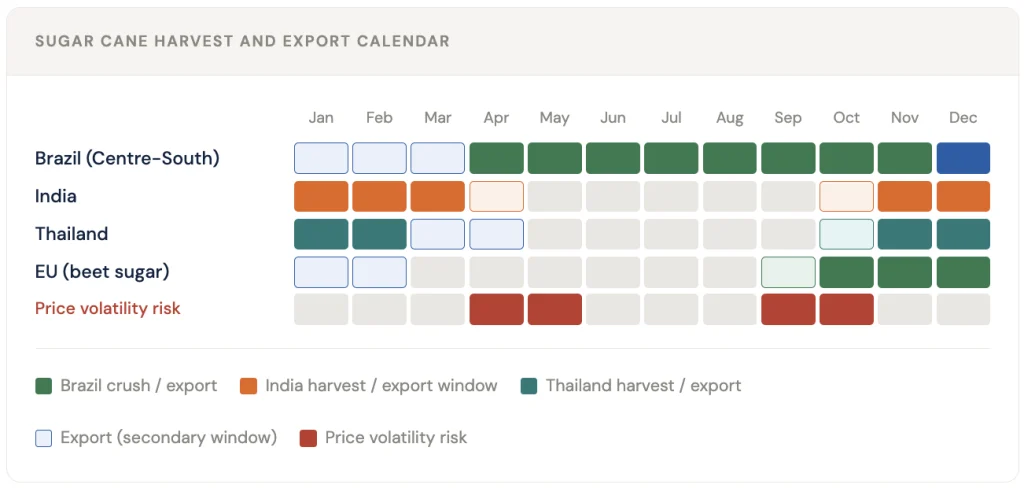
Price volatility tends to peak twice during the calendar year. The first window is April-May, when the Brazilian crush season begins and the market assesses cane quality and the initial sugar-ethanol allocation. The second is September-October, when the Indian government announces its export quota decision and Brazil’s crush season approaches its end. Both periods involve significant market repricing as supply expectations are reset for the coming months.
What to watch in the global sugar market
Key takeaways
Sugar pricing is driven by a unique combination of agricultural variables and energy market dynamics. Brazil’s dominance — roughly half of global exports — means that its mill allocation decisions, currency movements, and cane crop quality are the primary determinants of global price direction in most seasons. India’s export quota decisions add a second-order variable that can move prices significantly when Indian supply enters or exits world trade.
For procurement teams sourcing sugar across Africa, the Middle East, and South Asia, the ability to track Brazilian parity data, Indian quota announcements, and freight differentials between origins simultaneously is essential for securing supply at the right price and in the right specification. Platforms like Hectar provide the multi-origin price intelligence and trade flow visibility that commodity buyers need to make procurement decisions ahead of the market.